Technical Indicators: Enhancing Your Investment Decisions

Understanding Technical Indicators and Their Purpose
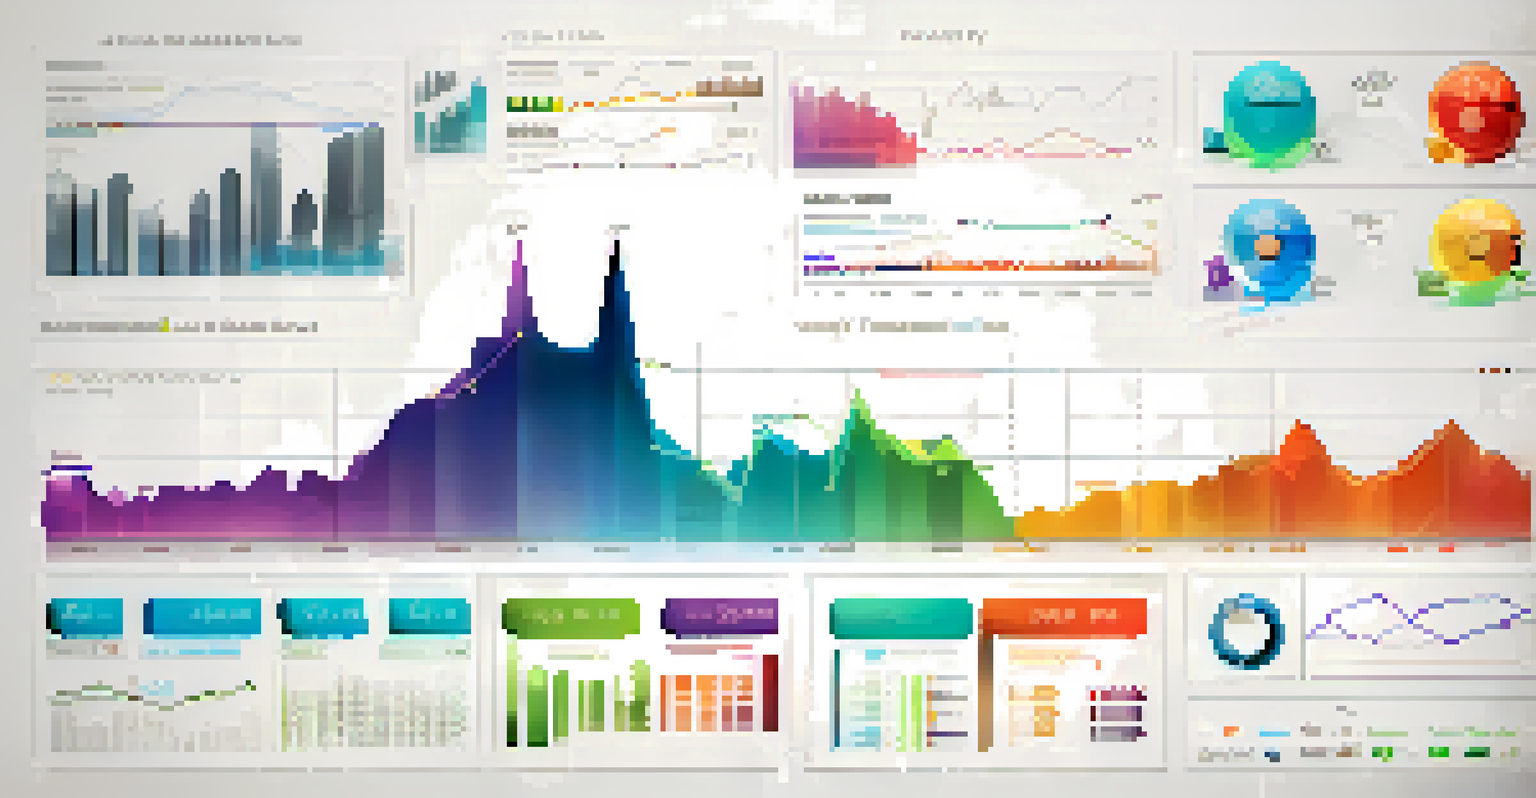
Technical indicators are mathematical calculations based on price and volume data. They help traders and investors make informed decisions by analyzing market trends and patterns. By applying these indicators, you can gain insights into potential price movements, which is crucial for making timely investment choices.
In trading and investing, what is comfortable is rarely profitable.
Imagine you're trying to navigate a new city without a map. Technical indicators act like your GPS, guiding you through the complexities of the financial market. They can help you identify the best entry and exit points for your trades, ultimately leading to better investment outcomes.
While there are many technical indicators available, it’s important to understand their specific uses and how they fit into your overall trading strategy. Some indicators focus on trends, while others may signal potential reversals. Knowing the purpose of each can significantly enhance your decision-making process.
Popular Types of Technical Indicators Explained
There are several popular technical indicators that traders frequently use, including Moving Averages, Relative Strength Index (RSI), and Bollinger Bands. Moving Averages smooth out price data over a set period, making it easier to identify trends. The RSI measures the speed and change of price movements, helping indicate whether an asset is overbought or oversold.
Bollinger Bands, on the other hand, consist of a moving average and two standard deviation lines. They help gauge market volatility and can signal potential price breakouts. By familiarizing yourself with these indicators, you can better understand market conditions and make more informed trading decisions.
Role of Technical Indicators
Technical indicators help traders analyze market trends and make informed investment decisions.
Each indicator serves a different purpose, so it's essential to choose the ones that align with your trading style. For instance, day traders might rely more on short-term indicators, while long-term investors may opt for those that provide a broader view of market trends.
How to Use Technical Indicators Effectively
To use technical indicators effectively, start by selecting a few that resonate with your trading strategy. Avoid the common pitfall of using too many indicators, which can lead to confusion. Instead, focus on a couple of reliable indicators that complement each other and provide clear signals.
Price is what you pay. Value is what you get.
For example, you could combine the Moving Average with the RSI to get a clearer picture of market conditions. While the Moving Average helps identify the trend direction, the RSI can confirm whether the asset is overbought or oversold. This combination can lead to more confident trading decisions.
It's also crucial to backtest your strategies using historical data. This process allows you to see how your chosen indicators would have performed in the past, helping you refine your approach before risking real money in the market.
The Importance of Market Context in Technical Analysis
While technical indicators are powerful tools, they should not be used in isolation. Understanding the broader market context is key to interpreting these indicators correctly. Factors like economic news, earnings reports, and geopolitical events can significantly influence market behavior.
For instance, a bullish signal from your technical indicator may not hold if there’s negative news impacting the entire market. By considering the context surrounding your trades, you can make more nuanced decisions and avoid falling victim to false signals.
Importance of Market Context
Understanding the broader market context is essential for accurately interpreting technical indicators.
Think of it like reading a weather forecast. While the forecast may suggest sunny skies, unexpected weather changes can still affect your plans. Always pair your technical analysis with a good understanding of the current market landscape.
Common Mistakes to Avoid When Using Indicators
One common mistake traders make is relying solely on technical indicators without considering other factors. Indicators can provide valuable insights, but they are not foolproof. It's essential to combine your analysis with fundamental insights and current market conditions to achieve a holistic view.
Another error is misinterpreting the signals. For example, a crossover on a Moving Average might indicate a buy signal, but an oversold RSI might suggest caution. Learning to read these signals in conjunction can prevent premature decisions that could lead to losses.
Lastly, many traders neglect to manage their risk properly. Even with the best indicators, losses can occur. Implementing stop-loss orders and managing your position sizes are vital strategies to protect your capital while utilizing technical indicators.
Building a Personal Strategy with Indicators
Creating a personal trading strategy using technical indicators involves trial and error. Start by experimenting with different indicators to see which ones resonate with your trading style. Keep a trading journal to track your trades and reflect on the effectiveness of your strategies.
As you gain experience, you can refine your approach based on what works for you. Maybe you find that certain indicators are more reliable in specific market conditions. Adapting your strategy based on your observations will help you become a more effective trader.
Avoiding Mistakes with Indicators
Traders should combine technical indicators with fundamental analysis and proper risk management to improve their trading outcomes.
Remember, investing is a journey, and developing your unique strategy takes time. Embrace the learning process, and don't be afraid to adjust your indicators as you grow in your trading experience.
The Future of Technical Indicators in Trading
As technology evolves, so do technical indicators. With advancements in artificial intelligence and machine learning, traders can now analyze vast amounts of data faster and more accurately. This shift may lead to the development of new indicators that could provide even deeper insights into market behavior.
Moreover, the rise of algorithmic trading means that indicators will play a crucial role in automated trading strategies. Understanding how these indicators work will be essential for anyone looking to compete in the increasingly tech-driven trading environment.

However, while technology enhances trading, the fundamentals of sound investing remain the same. Whether you’re a seasoned trader or just starting, understanding technical indicators will continue to be a vital part of successful trading in the future.